vSTREAM

Real-Time Visual Attribution Streaming in Thinking Model

Seil Kangʏ, Woojung Hanʏ, Junhyeok Kimʏ, Jinyeong Kimʏ, Youngeun Kim, Seong Jae Hwangʏ

ʏYonsei University   Amazon

vSTREAM Ours
REAL-TIME
Visual Input
a=3b=4c=?
Step 1 / 10
Thinking:
Region attribution
Steps grounded
0 / 10
Baseline
Visual Input
a=3b=4c=?
Computing…
CUDA out of memory
Tried to allocate 18.4 GiB
(32 layers × 32 heads × grad tensors)
Step 1 / 10
Thinking:
Region attribution
GPU Memory
35%

Computed after generation completes

Steps grounded
0 / 10

01
Faithful attribution without extra passes

A linear estimator predicts counterfactual region ablation effects from attention features that are already computed during generation. No extra backward passes, no repeated inference.

02
Streams as the model thinks

Attribution runs asynchronously in a background worker, so users can watch which image regions ground each reasoning step while the trace is still being generated, rather than waiting until it finishes.

03
One estimator, five tasks, four models

Trained once in about 4.5 hours on a single GPU with 2,000 examples, the estimator reaches faithfulness comparable to gradient- and perturbation-based baselines across five task families and four thinking VLMs.

Motivation

The faithfulness–efficiency gap

Multimodal reasoning models generate extended thinking traces that should be grounded in visual evidence. Verifying that grounding is hard: faithful causal methods require costly perturbations that scale with trace length, while raw attention weights are instant but causally unreliable.

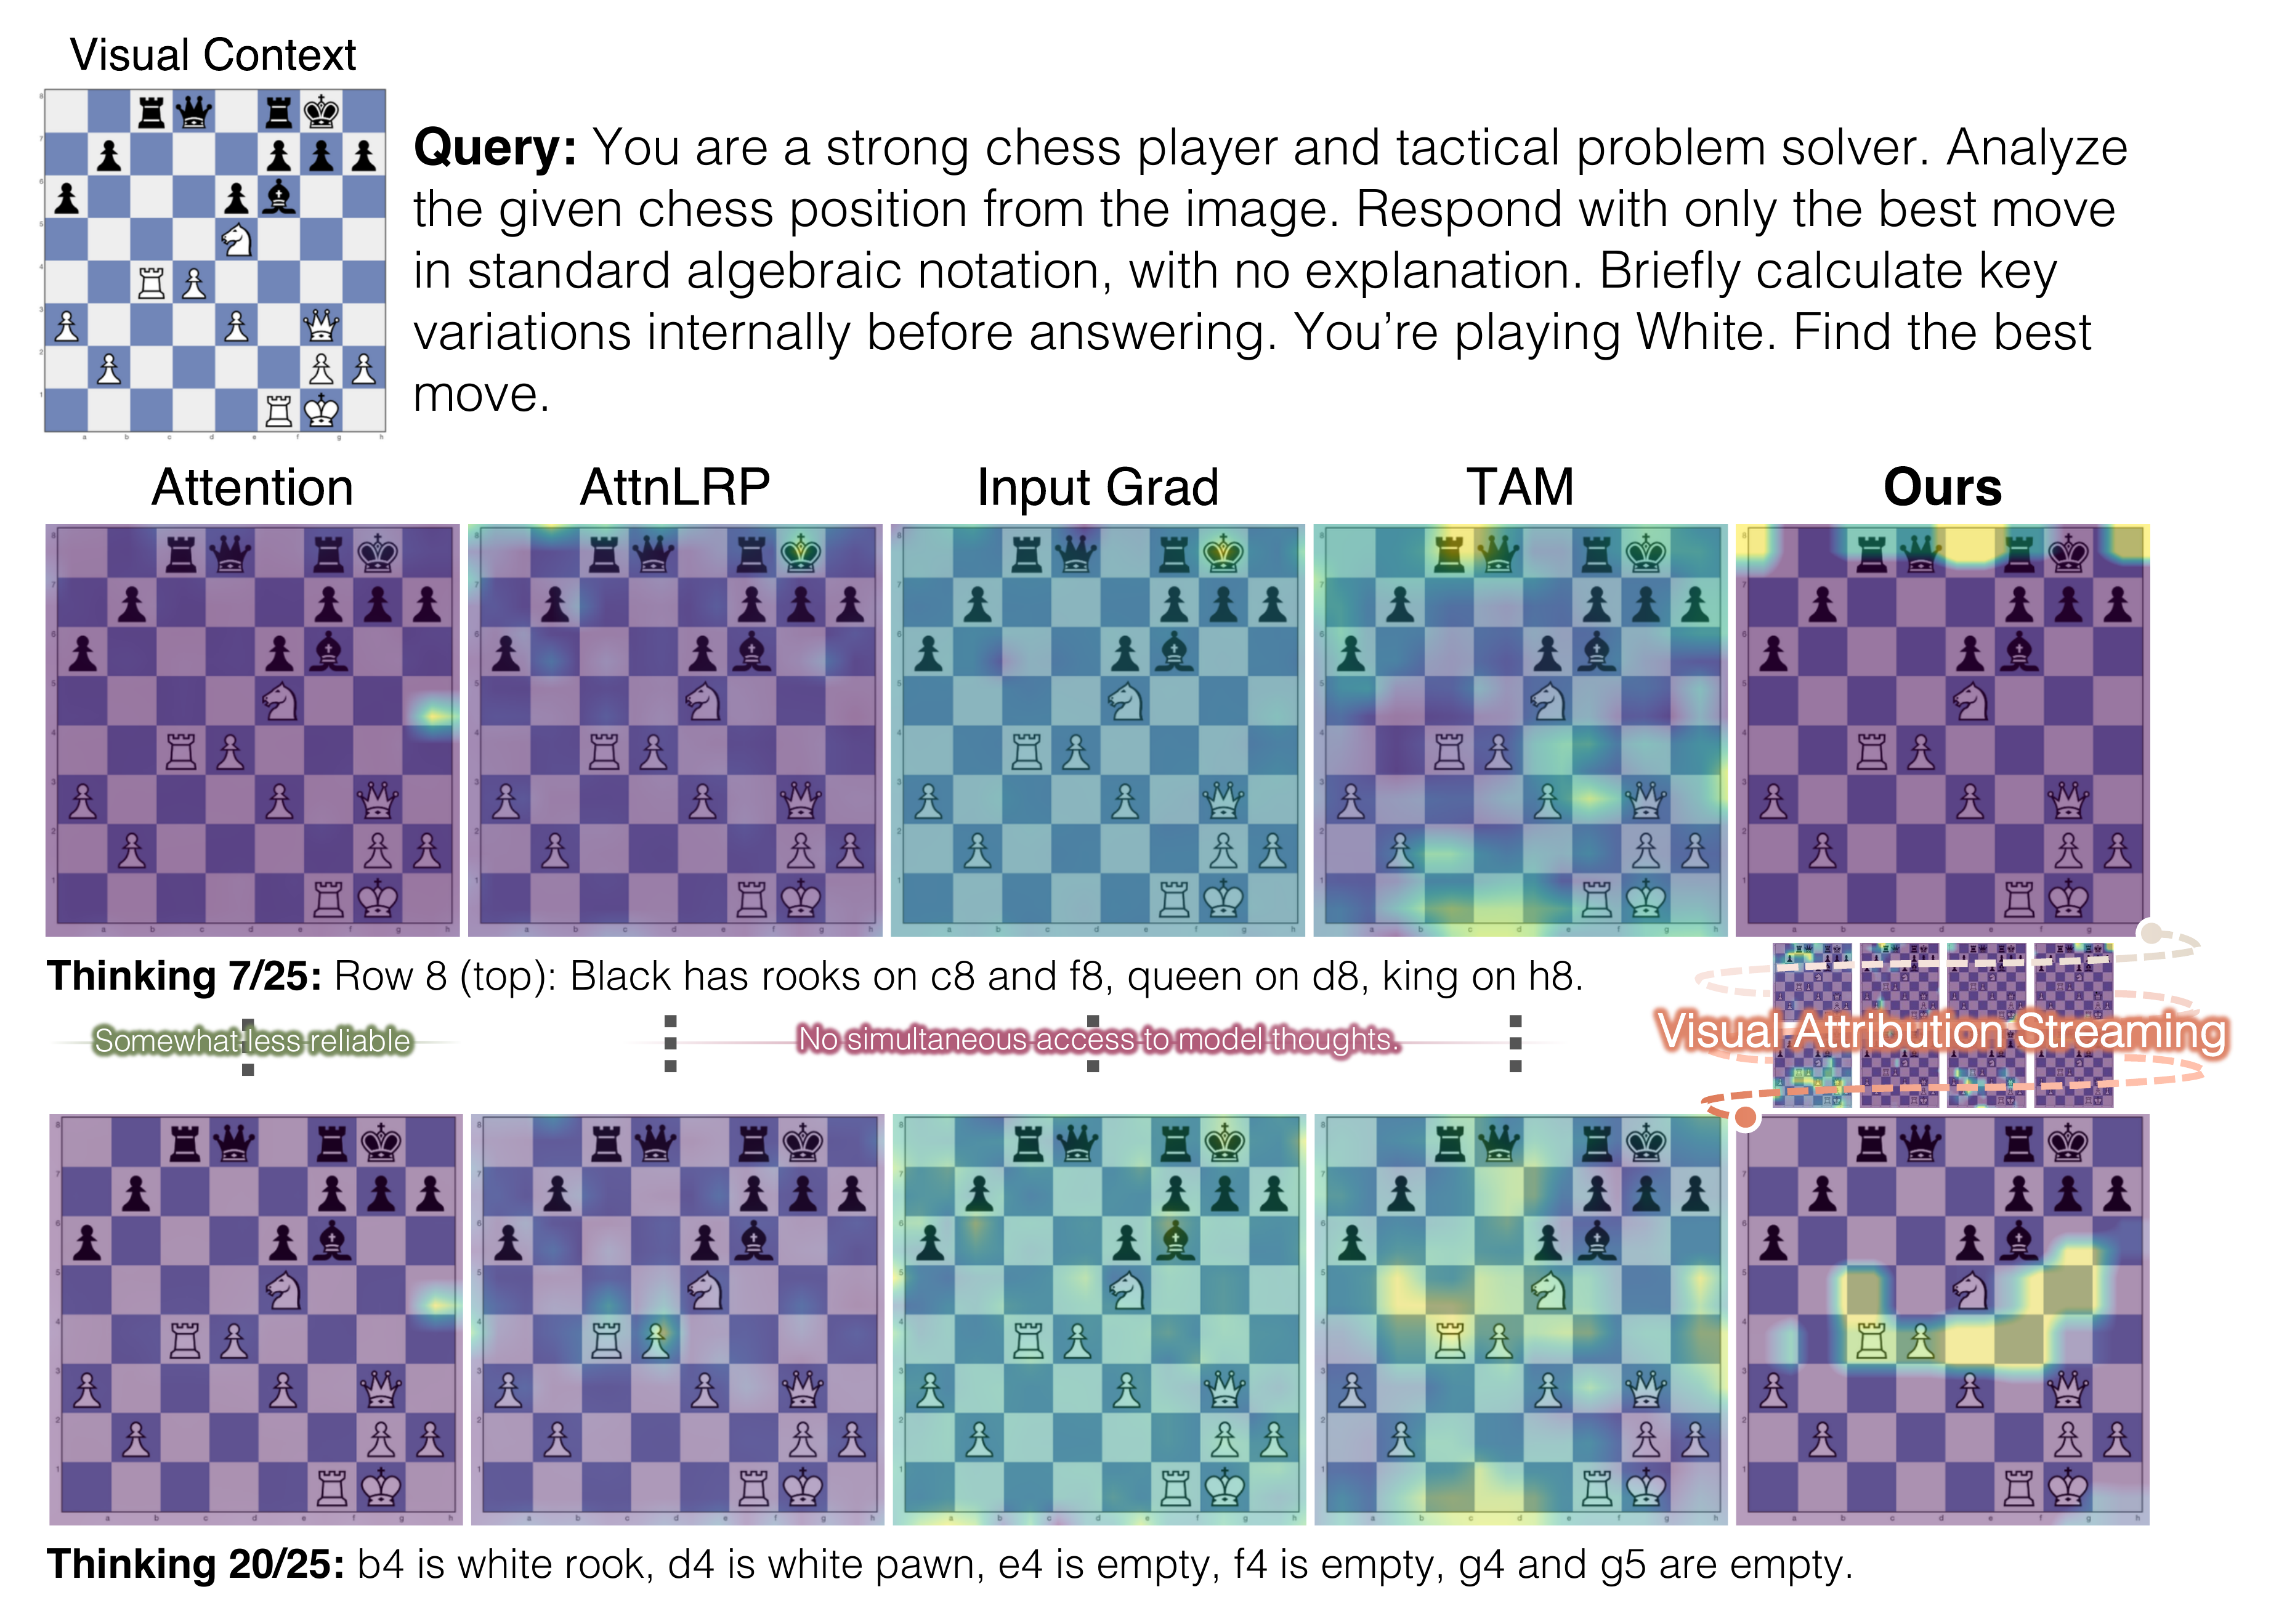
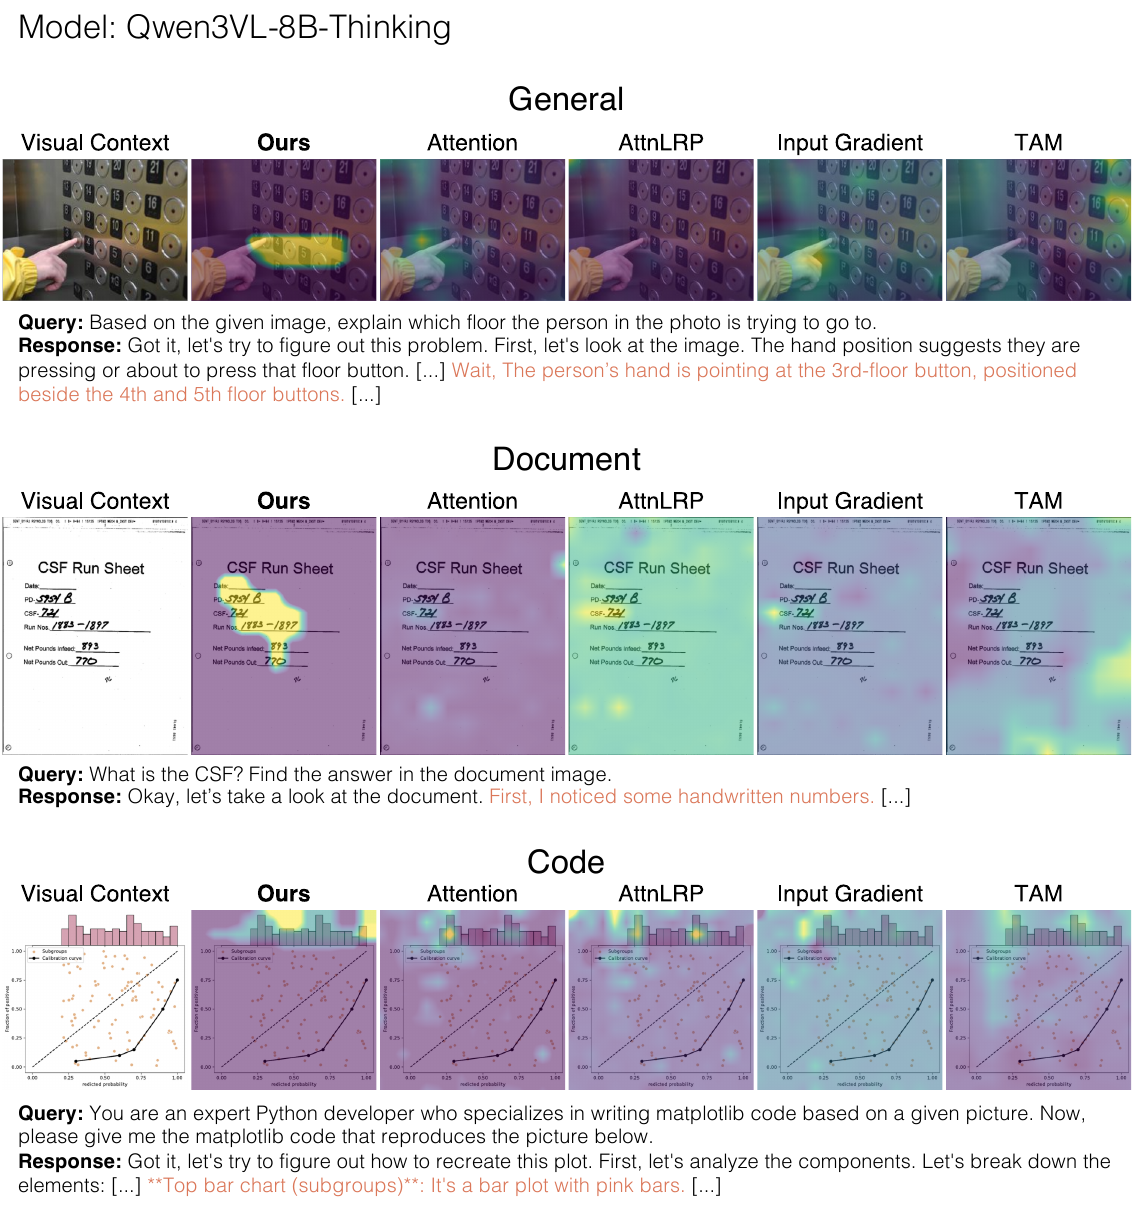
As reasoning traces extend to thousands of tokens, per-token latency for perturbation-based methods grows to the point where real-time analysis becomes infeasible for interactive debugging. A model may cite "the angle at vertex B" while attending to an irrelevant region, and existing methods either can't tell you, or tell you too slowly.

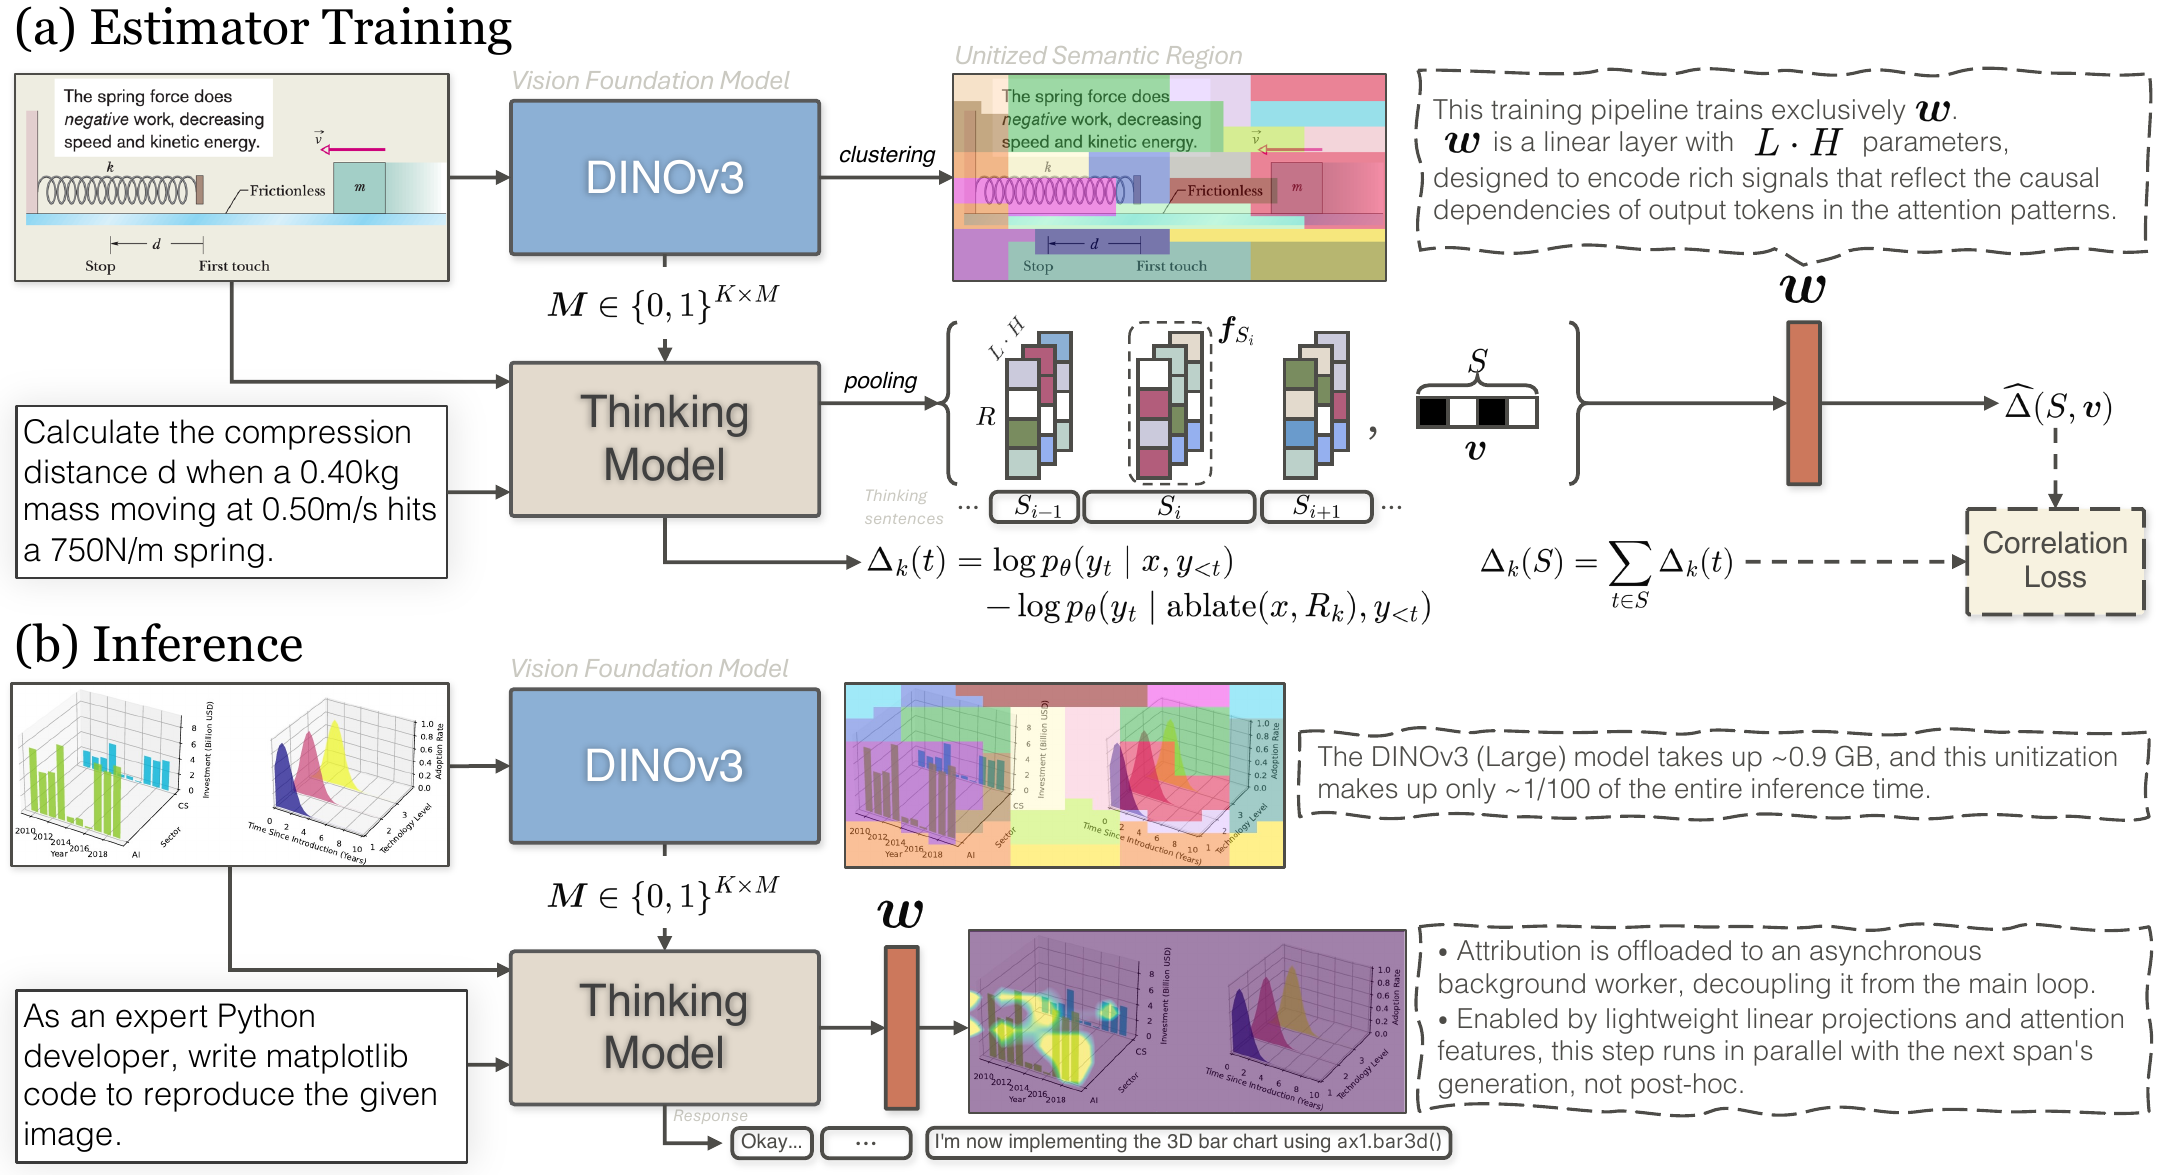
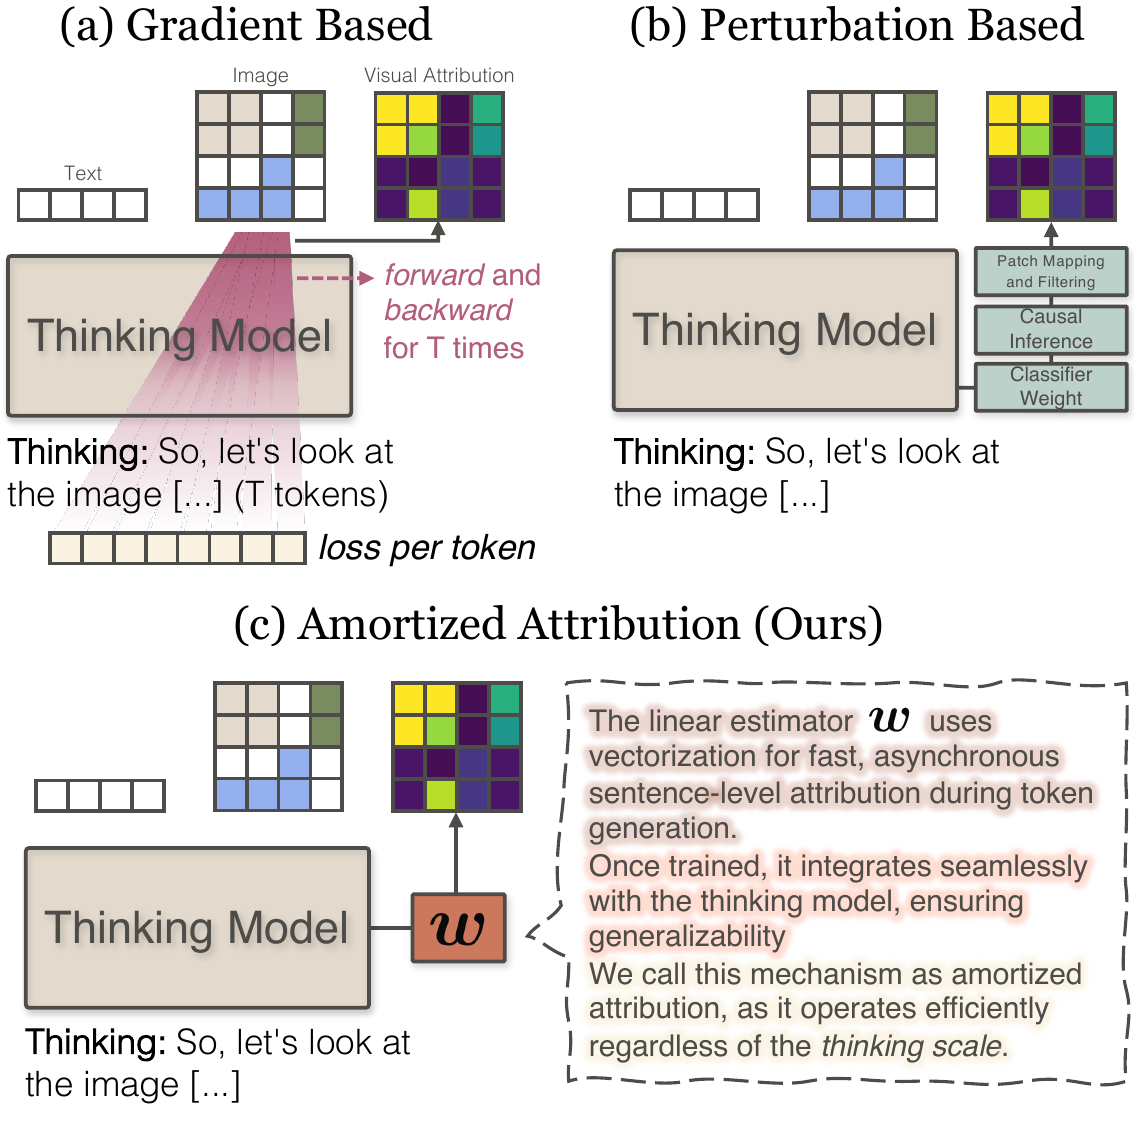
vSTREAM addresses this trade-off through amortized attribution: a linear estimator trained to predict region ablation effects from attention features, so faithful grounding evidence can be produced during generation rather than reconstructed afterward.

Faithfulness-efficiency tradeoff figure

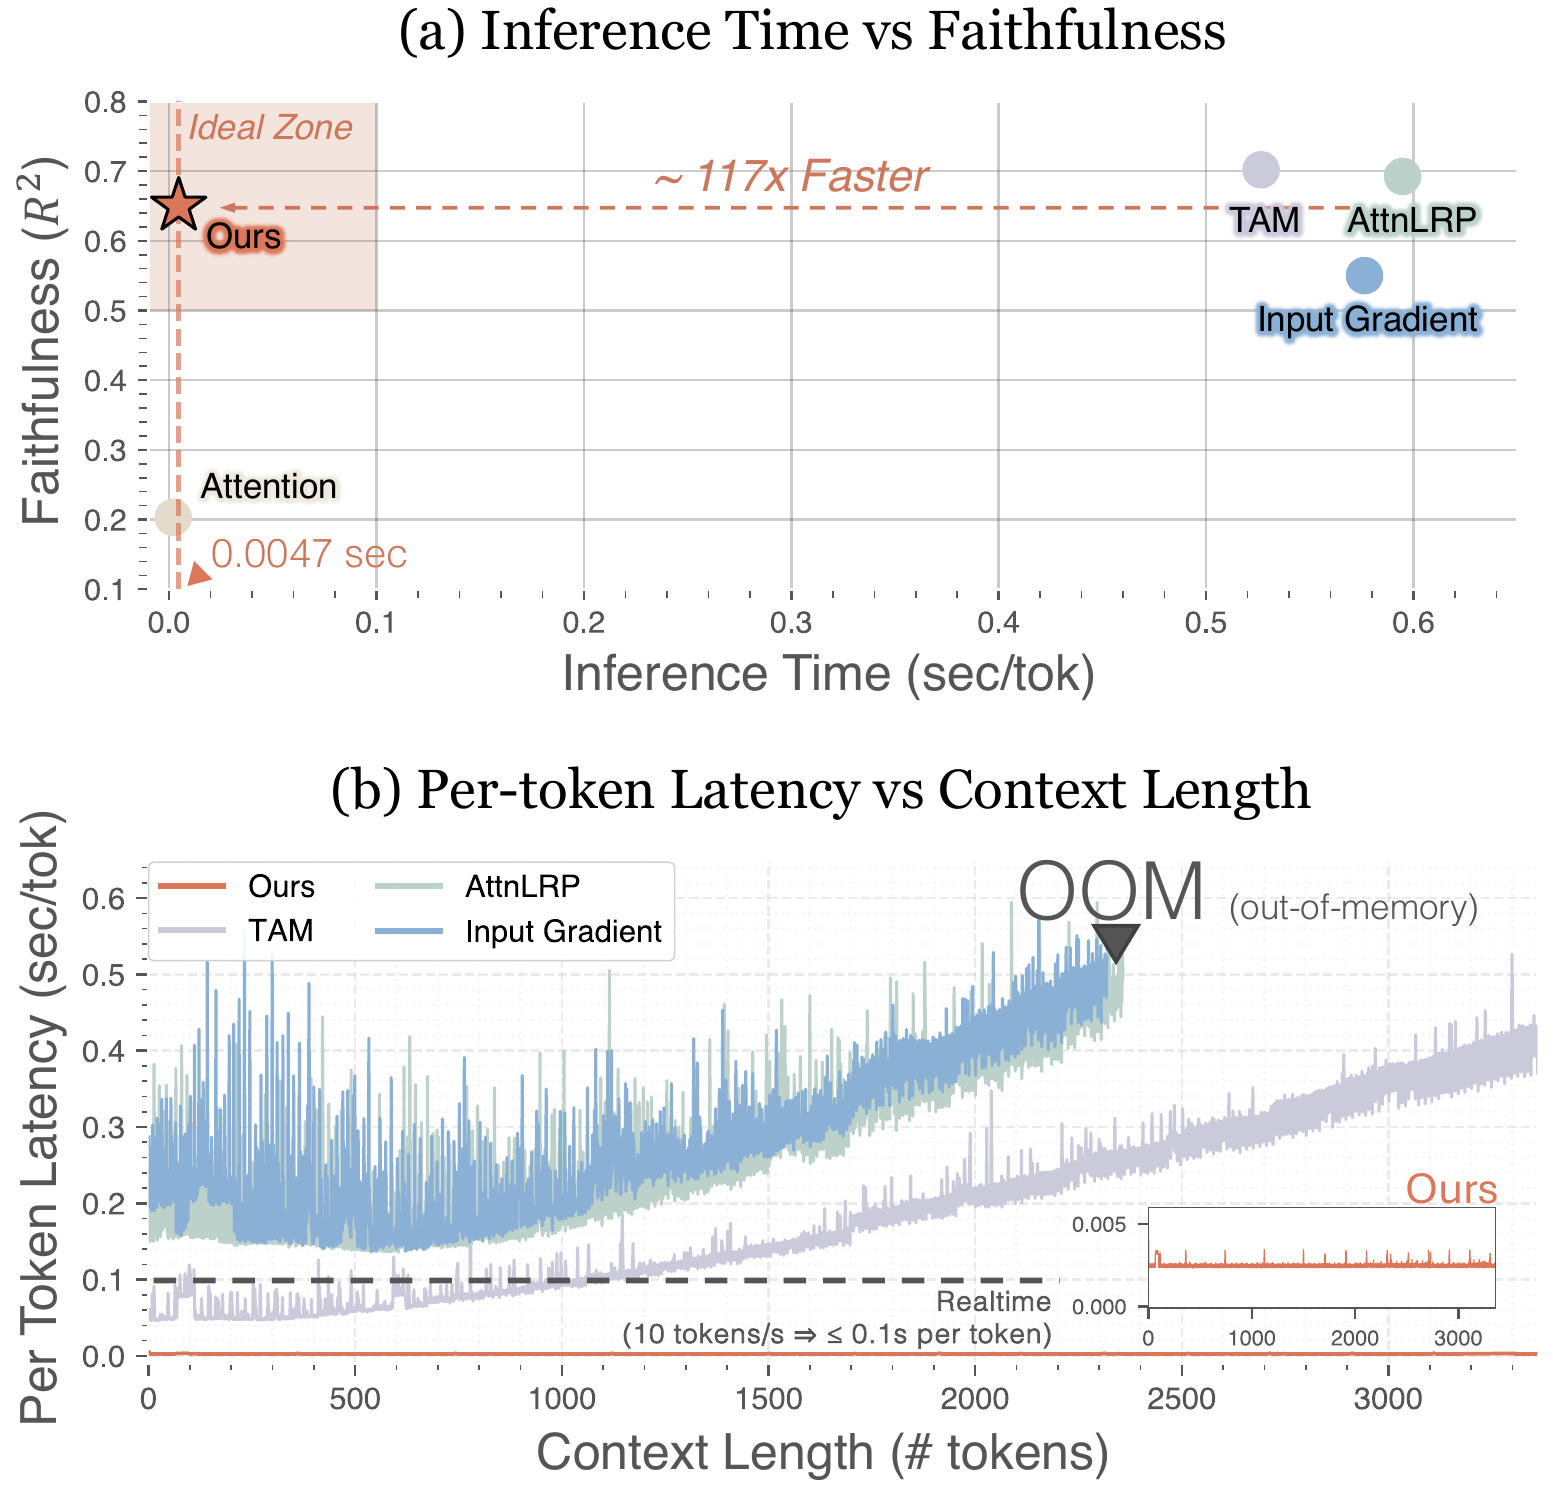
Figure 1. Existing attribution methods face competing demands of faithfulness and efficiency. vSTREAM sits in the top-right region, remaining faithful while running in real time.


Approach

Three-stage amortized pipeline

vSTREAM decomposes attribution into three stages: grouping image regions semantically, pooling cross-attention into a compact per-region feature, and predicting counterfactual ablation effects with a trained linear estimator. Scores are emitted span-by-span while the model is still generating.

Full pipeline overview

Pipeline overview. DINOv3 clustering partitions the image into semantic regions. Attention features are pooled per (span, region) pair. A linear estimator maps features to ablation effects and streams results asynchronously.

1
Semantic Region Unitization

DINOv3 features partition the image into K ∈ [16, 128] semantically coherent regions via agglomerative clustering with Ward's linkage. Each region corresponds to an interpretable unit (an object, text block, or diagram component), and no external segmentation masks are required.

DINOv3 + Ward's linkage
2
Attention Feature Extraction

For each thinking span S and region Rk, we mean-pool cross-attention weights across all layers and heads to form a feature vector f ∈ ℝL·H. Because these weights are already computed during generation, the extraction cost is negligible.

L×H features per region
3
Amortized Estimator & Streaming

A linear estimator with L·H parameters maps attention features to counterfactual ablation effects. It is trained once on 2,000 examples with a Pearson correlation loss. At inference, attribution runs in an asynchronous background worker via a producer-consumer queue, adding near-zero latency to the generation loop.

Async producer-consumer
Method comparison

Method comparison. Attention-based methods are instant but not causally faithful. Gradient and perturbation methods are faithful but require many extra passes. vSTREAM learns to predict ablation effects from attention features, so it approaches the faithfulness of perturbation methods while running in parallel with generation.


Qualitative Results

Attribution streaming across models

vSTREAM emits per-step visual attributions alongside the model's reasoning at near-zero latency. Prior methods produce a single post-hoc map after generation finishes; vSTREAM instead returns a separate attribution for each thinking span. Select a model to view examples.

Qualitative streaming results comparison

Qualitative comparison on a real-world sample (Qwen3-VL). vSTREAM emits per-step visual attributions as the model reasons, while prior methods only run post-hoc once generation has finished.

Qwen3-VL qualitative example

Qwen3-VL-8B-Thinking. Per-step attributions across the reasoning trace on a visual question. Each heatmap is computed for a separate thinking span.

GLM-4.1V qualitative example

GLM-4.1V-9B-Thinking. Per-step attributions across the reasoning trace on a diagram comprehension task.

MiMo-VL qualitative example

MiMo-VL-7B-RL. Per-step attributions across an extended reasoning trace.

Cosmos-Reason1 qualitative example

Cosmos-Reason1-7B. Per-step attributions on a science reasoning task, with region-level scores at each thinking step.


Quantitative Results

Faithful, efficient, and general

0.65
R² Prediction Quality

Between predicted and actual ablation effects, measured across all regions and spans.

16/20
Best or 2nd-best Top-5 Drop

Across 4 models and 5 task categories, vSTREAM matches the strongest baseline in most settings.

4.5h
One-time Training Cost

Single GPU, 2,000 examples. After training, attribution runs online with negligible per-token overhead.

Prediction quality

Prediction quality (R² = 0.65). Predicted vs. actual ablation effects across regions and spans.

Ablation: semantic regions vs geometric partitions

Ablation: region strategy. DINOv3-based semantic clustering outperforms random blocks and Voronoi tessellations on LDS.

Training data efficiency

Training data efficiency. LDS improves steeply up to about 500 examples, then converges; with 2,000 examples the estimator reaches full capacity. Practical for limited ablation budgets.

Cross-task Generalization

Training on one task category and evaluating on others (Qwen3-VL), in-domain LDS ranges from 0.70–0.74. Cross-task transfer retains 75–90% of in-domain performance for most pairs. Math and Science show mutual transfer at LDS 0.62–0.63, likely due to shared diagram structures; transfer to Document tasks is weaker (LDS 0.54–0.58). Training on a mixture of all categories recovers full performance, suggesting a single estimator suffices for diverse applications.


Analysis

Reasoning trajectory dynamics

Beyond static attribution maps, we ask whether the step-by-step evolution of visual reliance carries signal about reasoning quality. At each step we take the predicted region-effect vector, keep its top-32 entries, and project the resulting sequence to 3D with PCA. Successful and unsuccessful chains produce visibly different paths in this space.

Attribution trajectories

Attribution trajectories. PCA projection of per-step region-effect vectors. Successful chains (orange) follow compact, directed paths; unsuccessful chains (purple) are longer and more tangled, reflecting repeated reassignment of visual support.

Shorter paths in successful chains

Mean path length in PCA space is 0.003 for successful chains vs. 0.006 for unsuccessful ones (n=1500 each, p<10-4), consistent with more stable visual grounding during correct reasoning.

Lower tortuosity in successful chains

Tortuosity (path length divided by net displacement) drops from 25.4 in failures to 13.7 in successes. We read this as reduced hypothesis switching: successful chains commit to a consistent set of regions instead of reassigning visual support mid-reasoning.

Wandering vs. Fixation on POPE

Errors split into two geometrically distinct modes. Hallucinations sustain high attribution concentration on a single incorrect object (Fixation); reasoning errors show low, unstable concentration with repeated region switching (Wandering). Tortuosity-based failure prediction reaches AUC 0.69 by 30% of elapsed reasoning, and per-step fidelity R² begins to drop for incorrect chains at roughly 20% elapsed. Both signals need the per-step attribution stream; a post-hoc map discards them.

Trajectory statistics

Trajectory statistics. Path length and tortuosity distributions for correct vs. incorrect chains (n=1500 each, p<10-4). The wider spread on the incorrect side comes from unstable grounding during failed reasoning.


Citation

BibTeX

@misc{kang2026vstream,
  title  = {Real-Time Visual Attribution Streaming in Thinking Models},
  author = {Kang, Seil and Han, Woojung and Kim, Junhyeok and Kim, Jinyeong and Kim, Youngeun and Hwang, Seong Jae},
  year   = {2026}
}